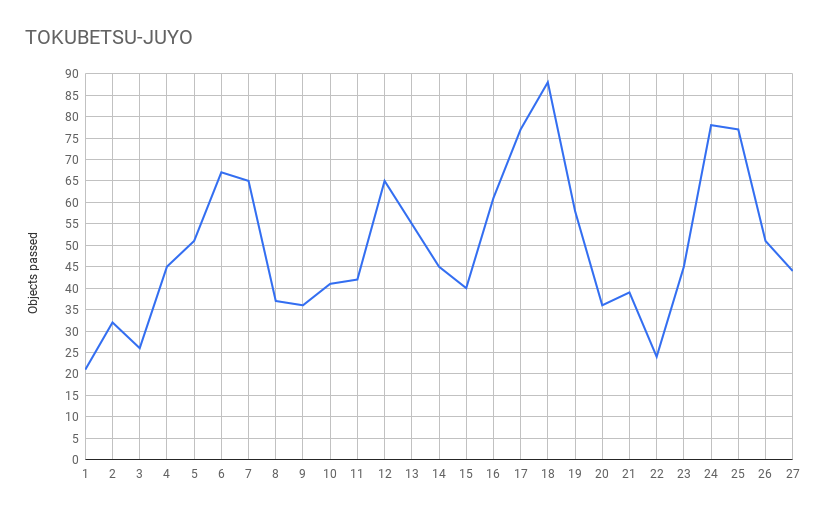
I was looking at some quantities of objects passing in specific NBTHK Jūyō and Tokubetsu-Jūyō Shinsa and so I thought it might be interesting for the one and other to see the ebb and flow of numbers over the years. That is, the numbers of objects that pass increases to a certain point and than the corrective kicks in, if you will, and subsequent Shinsa become once again tighter.
As for the years, the current Jūyō system started in 1958, and the first Tokubetsu-Jūyō Shinsa was held in 1971, just so that you get a better idea of the x axis of the two charts below.
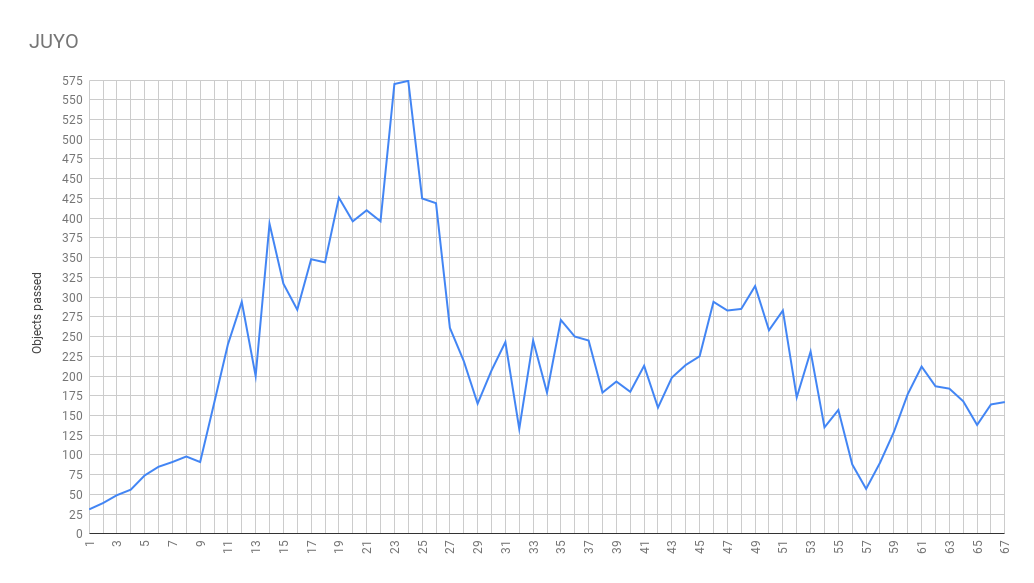

The Juyo chart is an eye opener. The difference in present pass rates vs. those in the early years is discussed here: https://www.militaria.co.za/nmb/topic/42731-j%C5%ABy%C5%8D-68-results/#comment-438251 It would be interesting to see the distribution of Juyo sessions that are represented among the swords awarded Toku-Juyo.
Interesting observation. I have heard people sometimes say that it is not a good time to submit for Juyo since they are tighter right now, numerous times over the years. Your data supports this.